Edit chart
Loading graph
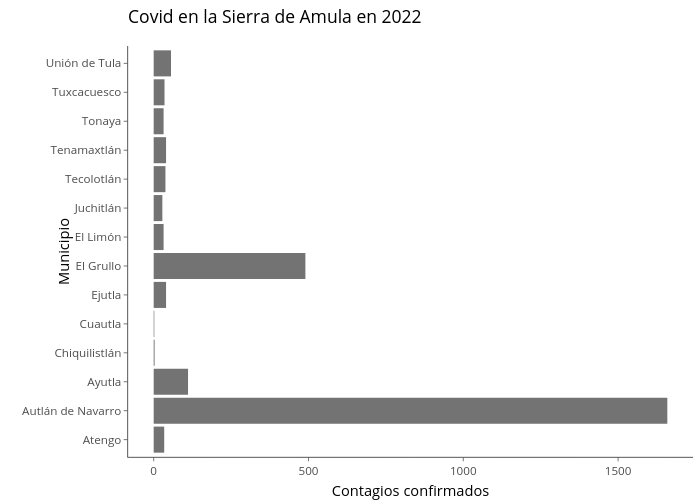
Laurorodriguez_'s interactive graph and data of "Covid en la Sierra de Amula en 2022" is a bar chart; with Contagios confirmados in the x-axis and Municipio in the y-axis.. The x-axis shows values from -82.95 to 1741.95. The y-axis shows values from 0.4 to 14.6.