Edit chart
Loading graph
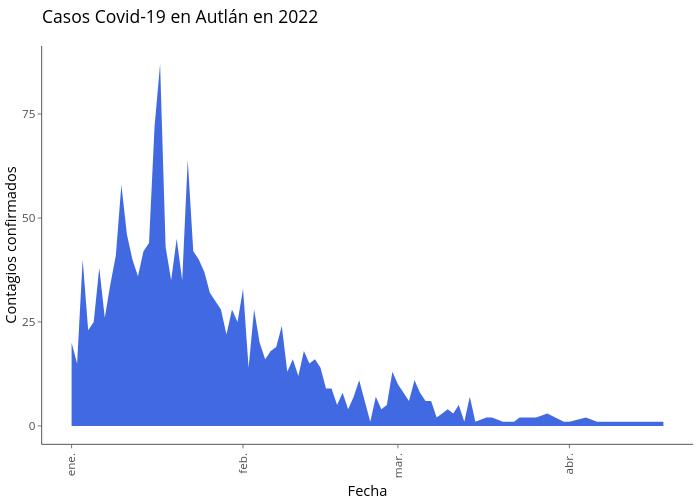
Laurorodriguez_'s interactive graph and data of "Casos Covid-19 en Autlán en 2022" is a filled line chart; with Fecha in the x-axis and Contagios confirmados in the y-axis.. The x-axis shows values from 18987.65 to 19105.35. The y-axis shows values from -4.35 to 91.35.