Edit chart
Loading graph
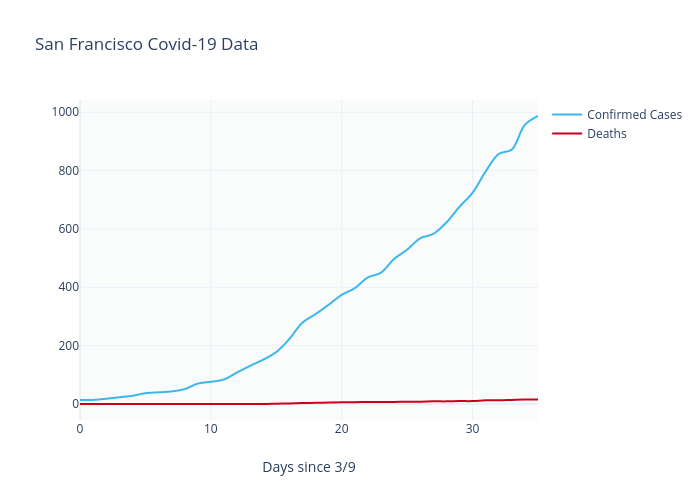
Lateralfilms's interactive graph and data of "San Francisco Covid-19 Data" is a line chart, showing %{meta.columnNames.y}, Confirmed Cases, %{meta.columnNames.y}; with Days since 3/9 in the x-axis. The x-axis shows values from 0 to 33. The y-axis shows values from -48.44444444444444 to 920.4444444444445.