Edit chart
Loading graph
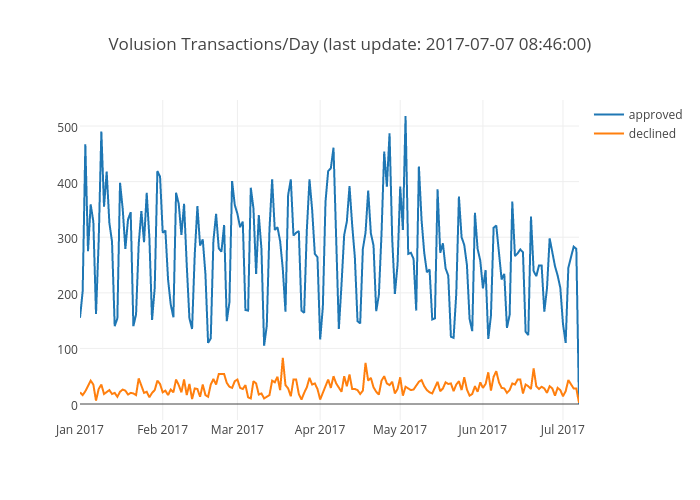
Kweatherston's interactive graph and data of "Volusion Transactions/Day (last update: 2017-07-07 08:46:00)" is a scatter chart, showing approved vs declined. The x-axis shows values from 0 to 0. The y-axis shows values from 0 to 0.