Edit chart
Loading graph
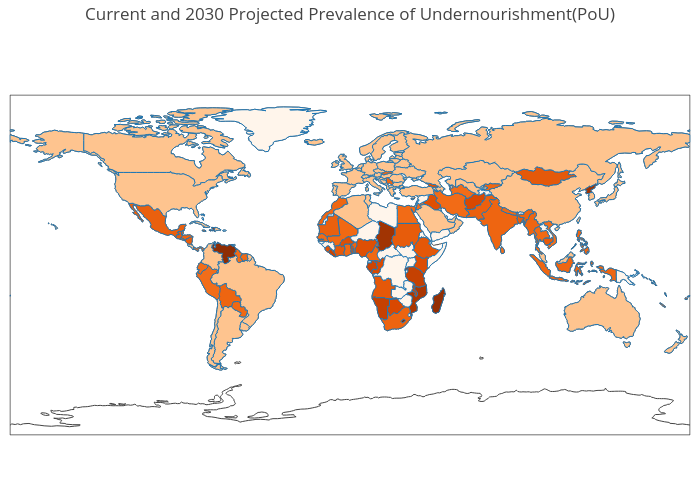
Krrsteven's interactive graph and data of "Current and 2030 Projected Prevalence of Undernourishment(PoU)" is a choropleth. The x-axis shows values from 0 to 0. The y-axis shows values from 0 to 0.