Edit chart
Loading graph
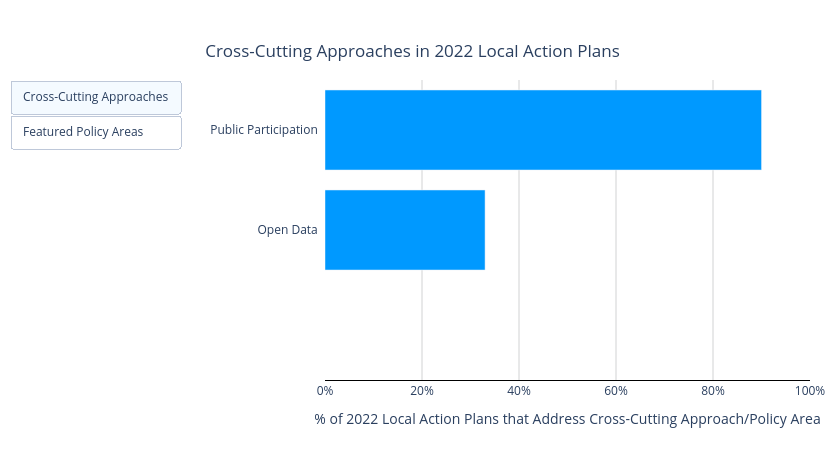
Kristenrose's interactive graph and data of "Cross-Cutting Approaches in 2022 Local Action Plans" is a bar chart; with % of 2022 Local Action Plans that Address Cross-Cutting Approach/Policy Area in the x-axis. The x-axis shows values from 0 to 1. The y-axis shows values from 0 to 0.