Edit chart
Loading graph
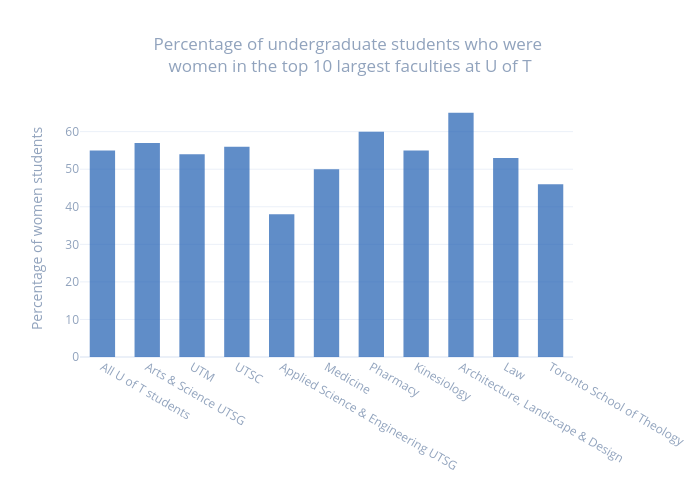
Kmannie's interactive graph and data of "Percentage of undergraduate students who were women in the top 10 largest faculties at U of T" is a bar chart; with Percentage of women students in the y-axis. The x-axis shows values from -0.5 to 10.5. The y-axis shows values from 0 to 68.42105263157895.