Edit chart
Loading graph
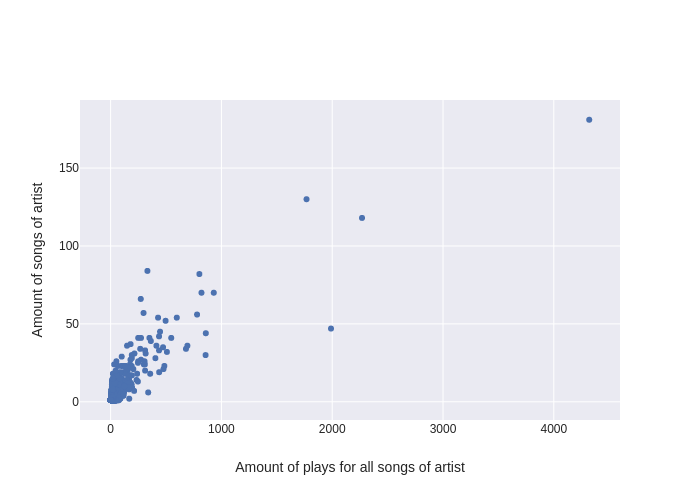
Kjevo's interactive graph and data of "Amount of songs of artist vs Amount of plays for all songs of artist" is a scatter chart; with Amount of plays for all songs of artist in the x-axis and Amount of songs of artist in the y-axis.. The x-axis shows values from -249.30116252302028 to 4570.30116252302. The y-axis shows values from -9.950570342205324 to 191.9505703422053.