Edit chart
Loading graph
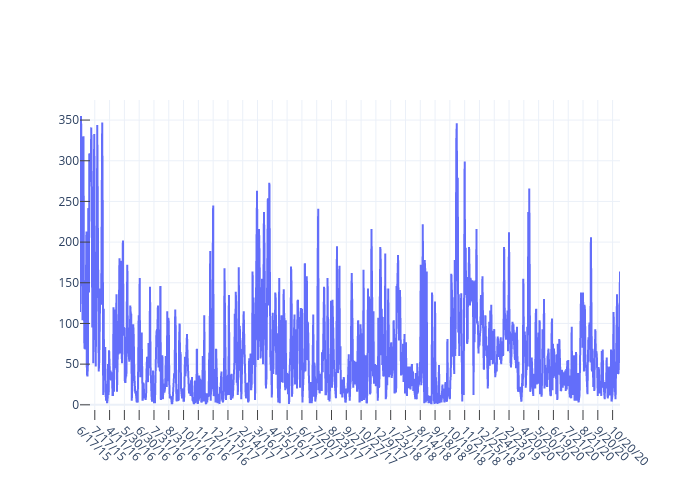
Kjevo's interactive graph and data is a line chart. The x-axis shows values from 0 to 1095. The y-axis shows values from -18.666666666666664 to 374.6666666666667.