Edit chart
Loading graph
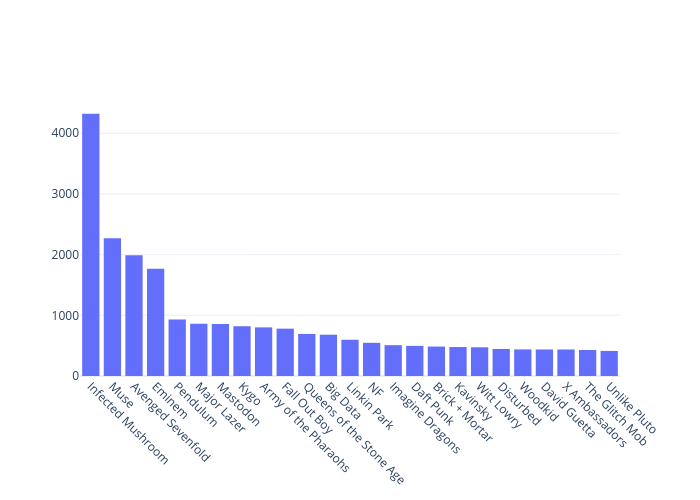
Kjevo's interactive graph and data is a bar chart. The x-axis shows values from -0.5 to 24.5. The y-axis shows values from 0 to 4547.368421052632.