Edit chart
Loading graph
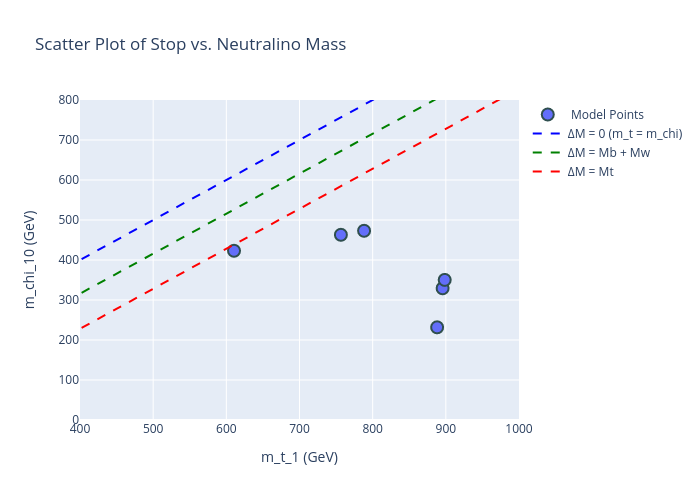
Kiran4's interactive graph and data of "Scatter Plot of Stop vs. Neutralino Mass" is a scatter chart, showing Model Points, ΔM = 0 (m_t = m_chi), ΔM = Mb + Mw, ΔM = Mt; with m_t_1 (GeV) in the x-axis and m_chi_10 (GeV) in the y-axis.. The x-axis shows values from 400 to 1000. The y-axis shows values from 0 to 800.