Edit chart
Loading graph
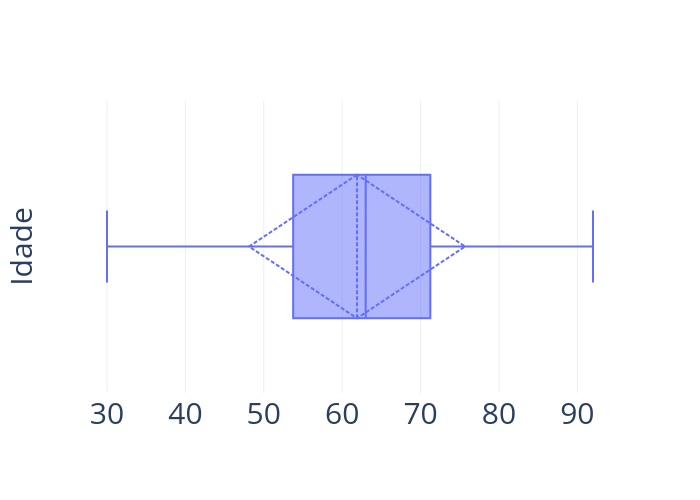
Kigrl's interactive graph and data of "Idade vs " is a box plot, showing ; with in the x-axis and Idade in the y-axis.. The x-axis shows values from 26.555555555555557 to 95.44444444444444. The y-axis shows values from -0.5 to 0.5.