Edit chart
Loading graph
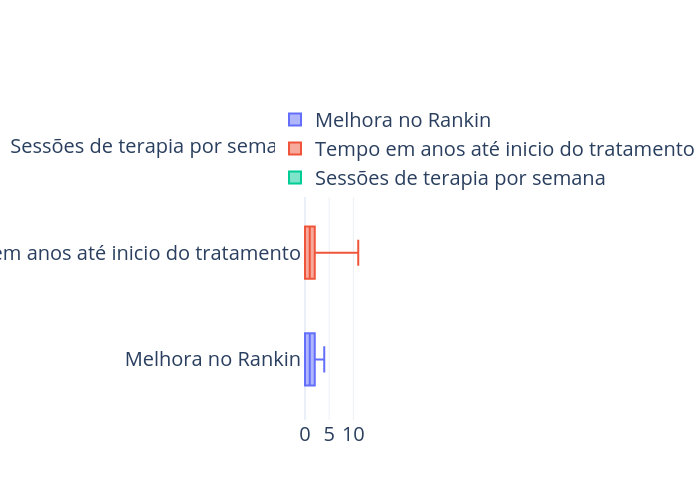
Kigrl's interactive graph and data of "Melhora no Rankin, Tempo em anos até inicio do tratamento, Sessões de terapia por semana" is a box plot, showing Melhora no Rankin, Tempo em anos até inicio do tratamento, Sessões de terapia por semana. The x-axis shows values from -0.611111111111111 to 12.61111111111111. The y-axis shows values from -0.5683111954459203 to 2.4316888045540797.