Edit chart
Loading graph
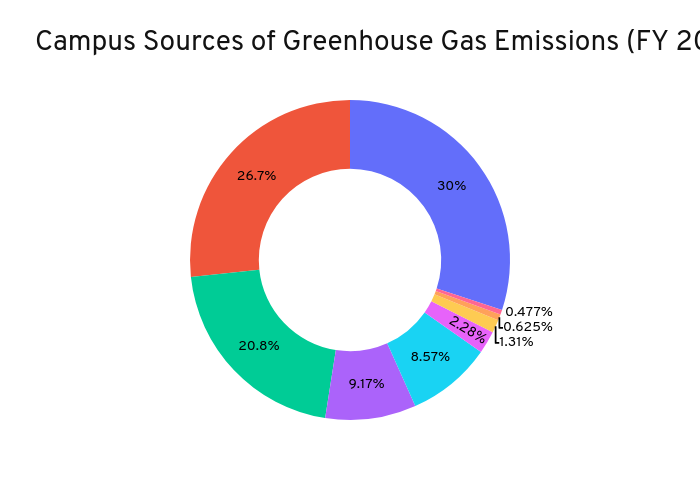
Khickman's interactive graph and data of "Campus Sources of Greenhouse Gas Emissions (FY 2020)" is a pie, showing Sources of GHG. The x-axis shows values from -1 to 6. The y-axis shows values from -1 to 4.