Edit chart
Loading graph
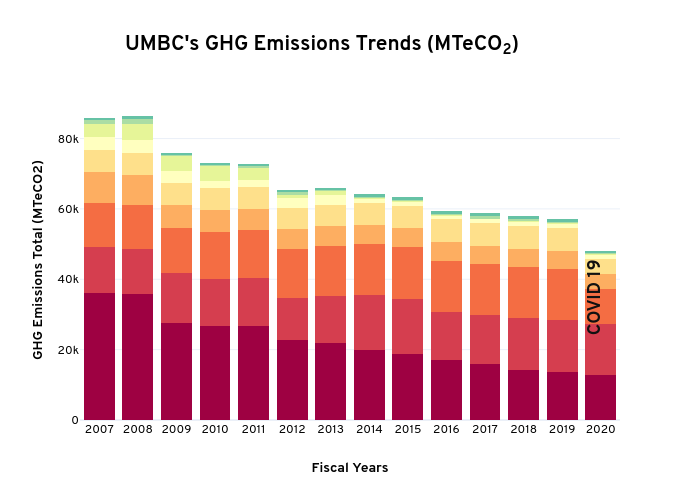
Khickman's interactive graph and data of "UMBC's GHG Emissions Trends (MTeCO2)" is a stacked bar chart, showing Purchased Electricity, Stationary Combustion, Student Commuting, Air Travel, Staff/Faculty Commuting , T&D Losses, Solid Waste, Refrigerants & Chemicals , Unversity Fleet, Fertilizer ; with Fiscal Years in the x-axis and GHG Emissions Total (MTeCO2) in the y-axis.. The x-axis shows values from -0.5 to 13.5. The y-axis shows values from 0 to 90946.2842105263. This visualization has the following annotation: COVID 19