Edit chart
Loading graph
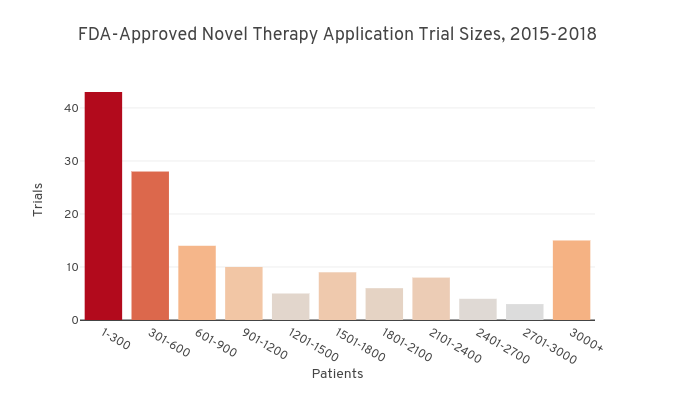
Kevkunzmann's interactive graph and data of "FDA-Approved Novel Therapy Application Trial Sizes, 2015-2018" is a bar chart; with Patients in the x-axis and Trials in the y-axis.. The x-axis shows values from -0.5 to 10.5. The y-axis shows values from 0 to 45.26315789473684.