Edit chart
Loading graph
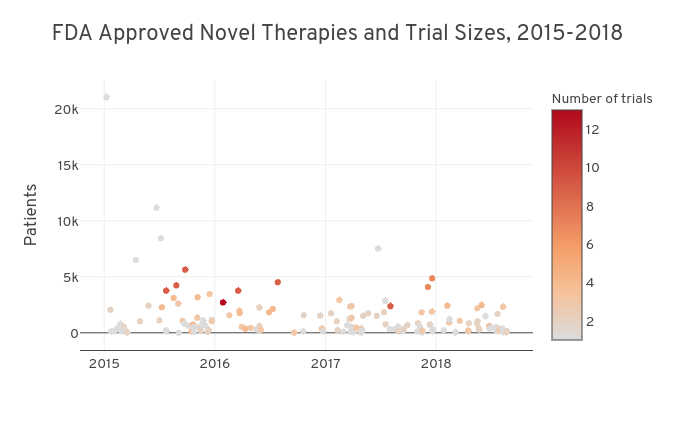
Kevkunzmann's interactive graph and data of "FDA Approved Novel Therapies and Trial Sizes, 2015-2018" is a scatter chart, showing ; with Patients in the y-axis. The x-axis shows values from 2014-10-12 18:15:14.1998 to 2018-11-17 05:44:45.8002. The y-axis shows values from -1535.8280254777071 to 22565.828025477706.