Edit chart
Loading graph
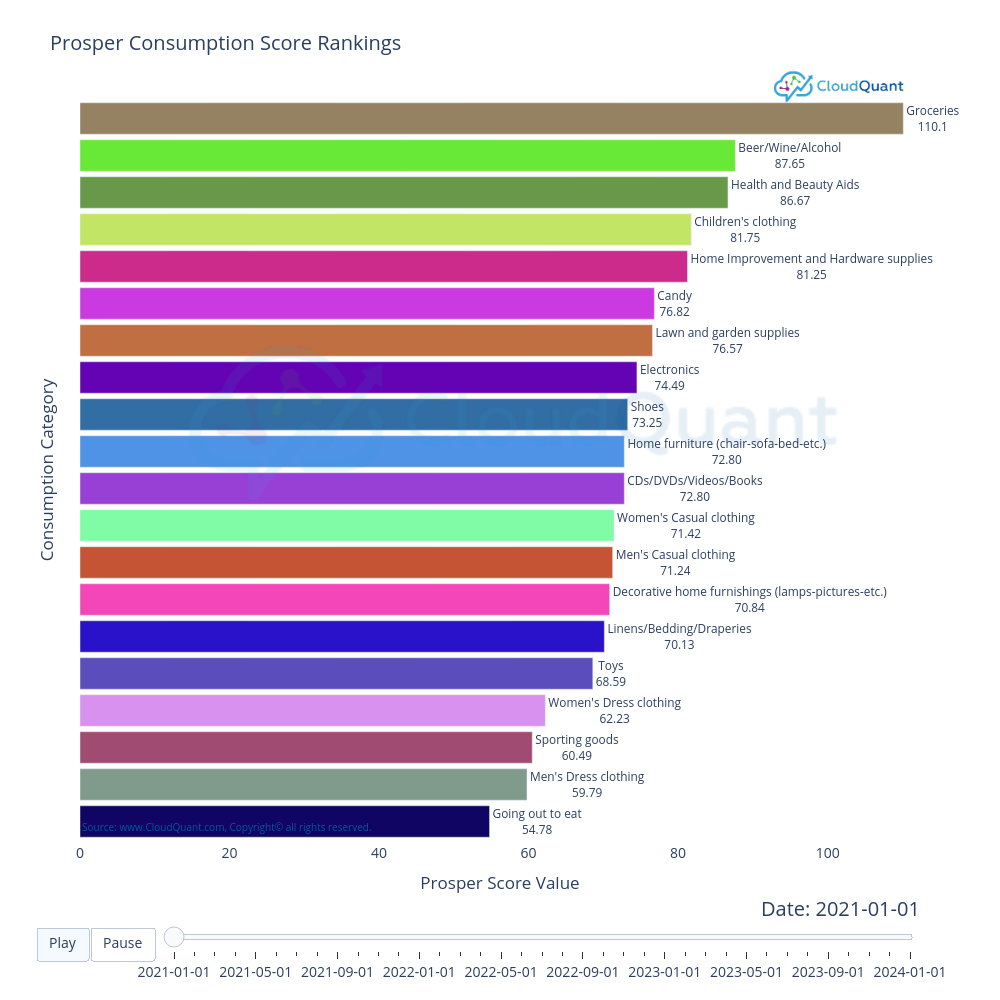
Kevinwei94's interactive graph and data of "Prosper Consumption Score Rankings" is a bar chart; with Prosper Score Value in the x-axis and Consumption Category in the y-axis.. The x-axis shows values from 0 to 112.35154528318895. The y-axis shows values from 0 to 0. This visualization has the following annotation: Source: www.CloudQuant.com, Copyright© all rights reserved.