Edit chart
Loading graph
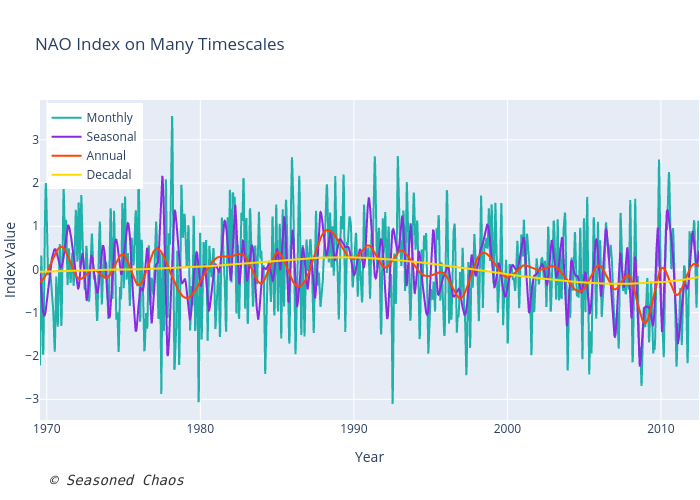
Kelseymalloy's interactive graph and data of "NAO Index on Many Timescales" is a line chart, showing Monthly, Seasonal, Annual, Decadal; with Year in the x-axis and Index Value in the y-axis.. The x-axis shows values from 0 to 0. The y-axis shows values from 0 to 0. This visualization has the following annotation: © Seasoned Chaos