Edit chart
Loading graph
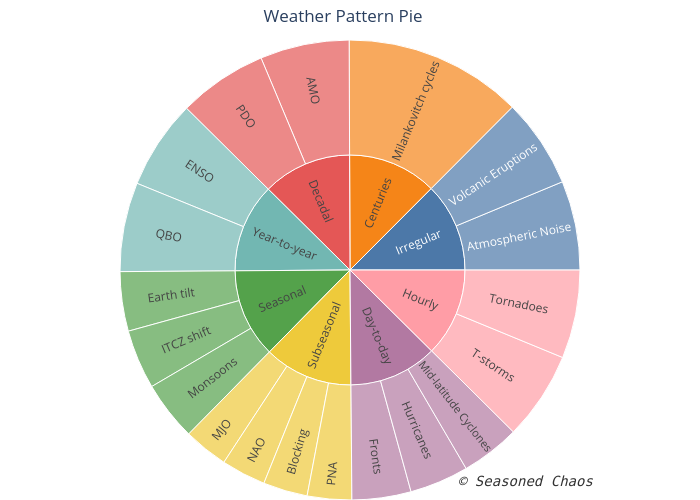
Kelseymalloy's interactive graph and data of "Weather Pattern Pie" is a sunburst. The x-axis shows values from 0 to 0. The y-axis shows values from 0 to 0. This visualization has the following annotation: © Seasoned Chaos