Edit chart
Loading graph
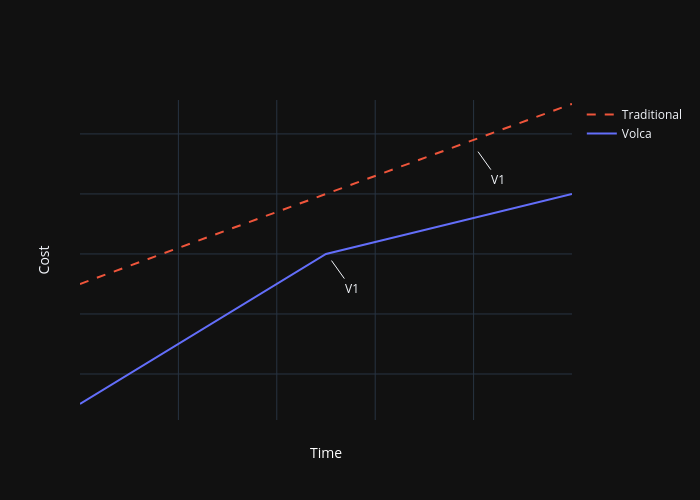
Karl.eriksson's interactive graph and data of "" is a line chart, showing Volca vs Traditional; with Time in the x-axis and Cost in the y-axis.. The x-axis shows values from 0 to 50. The y-axis shows values from 2.3344134986542087 to 55.65. This visualization has the following annotations: V1; V1