Edit chart
Loading graph
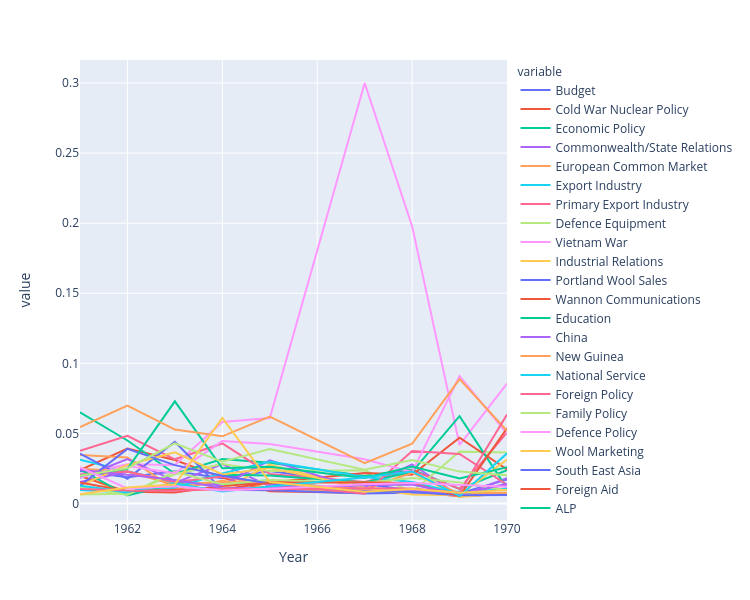
Kabirmanandharsth's interactive graph and data of "value vs Year" is a line chart, showing Budget, Cold War Nuclear Policy, Economic Policy, Commonwealth/State Relations, European Common Market, Export Industry, Primary Export Industry, Defence Equipment, Vietnam War, Industrial Relations, Portland Wool Sales, Wannon Communications, Education, China, New Guinea, National Service, Foreign Policy, Family Policy, Defence Policy, Wool Marketing, South East Asia, Foreign Aid, ALP, Agricultural Policy, Parliament, Wannon , Housing Policy, Politics, Canberra Development, USA; with Year in the x-axis and value in the y-axis.. The x-axis shows values from 0 to 0. The y-axis shows values from 0 to 0.