Edit chart
Loading graph
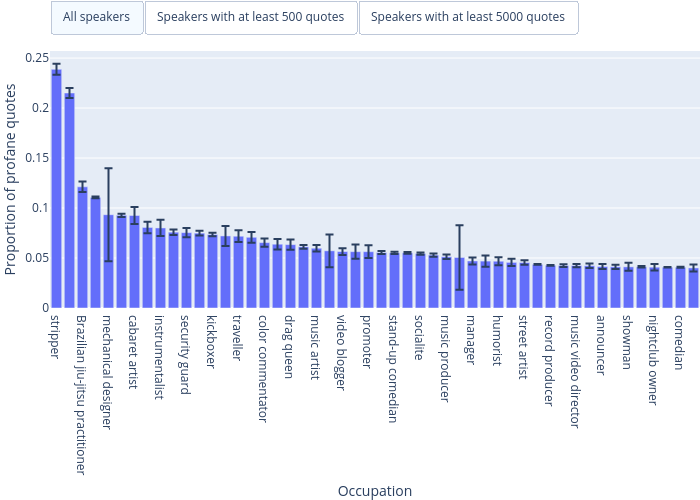
K_beans's interactive graph and data of "Proportion of profane quotes vs Occupation" is a bar chart; with Occupation in the x-axis and Proportion of profane quotes in the y-axis.. The x-axis shows values from -0.5 to 49.5. The y-axis shows values from 0 to 0.25707988035942186.