Edit chart
Loading graph
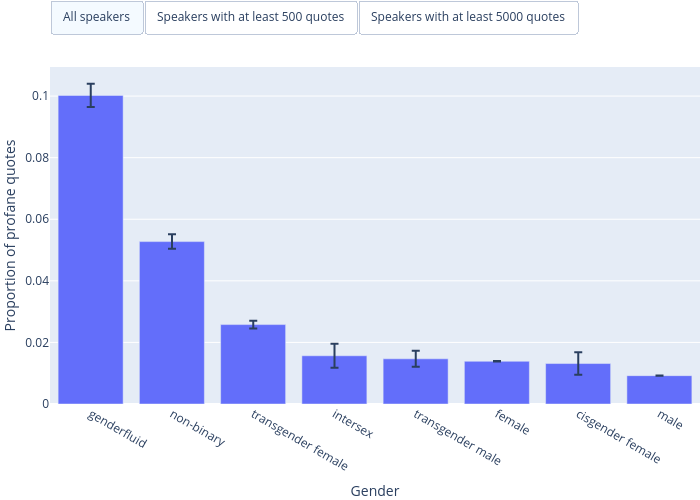
K_beans's interactive graph and data of "Proportion of profane quotes vs Gender" is a bar chart; with Gender in the x-axis and Proportion of profane quotes in the y-axis.. The x-axis shows values from -0.5 to 7.5. The y-axis shows values from 0 to 0.10944726277271173.