Edit chart
Loading graph
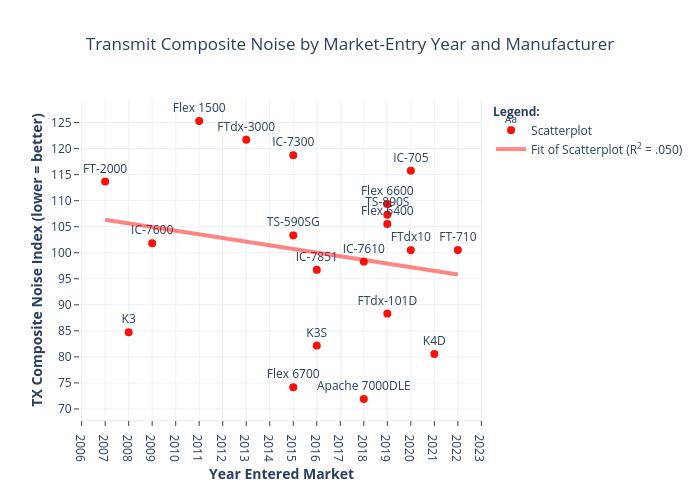
K4fmh's interactive graph and data of "Transmit Composite Noise by Market-Entry Year and Manufacturer" is a , showing Scatterplot vs Fit of Scatterplot (R2 = .050); with Year Entered Market in the x-axis and TX Composite Noise Index (lower = better) in the y-axis.. The x-axis shows values from 2006.0849352687328 to 2022.9150647312672. The y-axis shows values from 68.26280711825487 to 128.9471928817451.