Edit chart
Loading graph
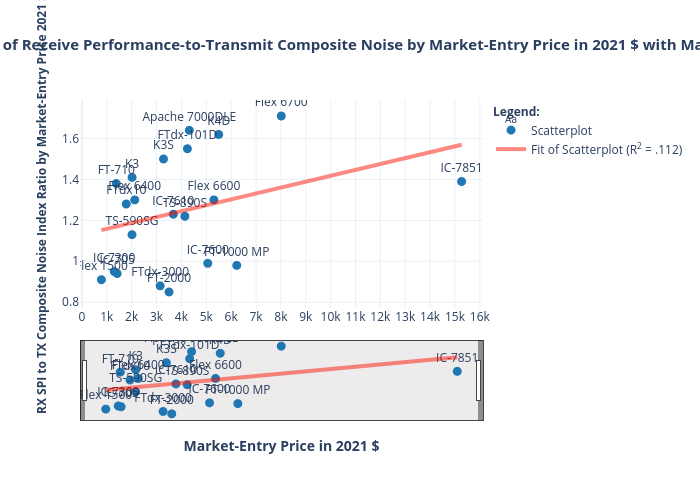
K4fmh's interactive graph and data of "Scatterplot of Receive Performance-to-Transmit Composite Noise by Market-Entry Price in 2021 $ with Manufacturer" is a , showing Scatterplot vs Fit of Scatterplot (R2 = .112); with Market-Entry Price in 2021 $ in the x-axis and RX SPI to TX Composite Noise Index Ratio by Market-Entry Price 2021 $ in the y-axis.. The x-axis shows values from -77.45252553389037 to 16126.832525533891. The y-axis shows values from 0.7839305768249106 to 1.7760694231750893.