Edit chart
Loading graph
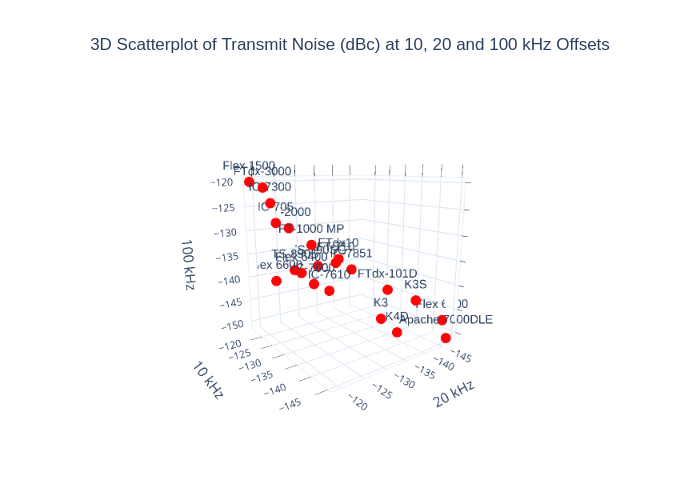
K4fmh's interactive graph and data of "3D Scatterplot of Transmit Noise (dBc) at 10, 20 and 100 kHz Offsets" is a scatter3d, showing TX Noise (dBc). The x-axis shows values from -1 to 6. The y-axis shows values from -1 to 4.