Edit chart
Loading graph
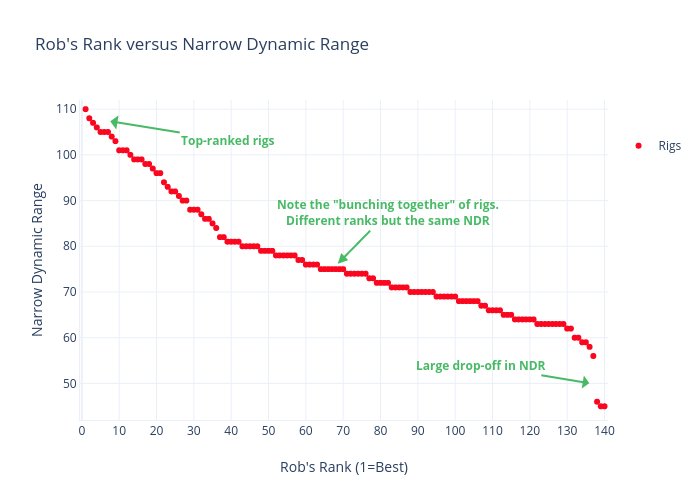
K4fmh's interactive graph and data of "Rob's Rank versus Narrow Dynamic Range" is a scatter chart, showing Rigs; with Rob's Rank (1=Best) in the x-axis and Narrow Dynamic Range in the y-axis.. The x-axis shows values from -0.49431592287617304 to 140.9303067274717. The y-axis shows values from 42 to 112. This visualization has the following annotations: Note the "bunching together" of rigs.Different ranks but the same NDR; Large drop-off in NDR; Top-ranked rigs