Edit chart
Loading graph
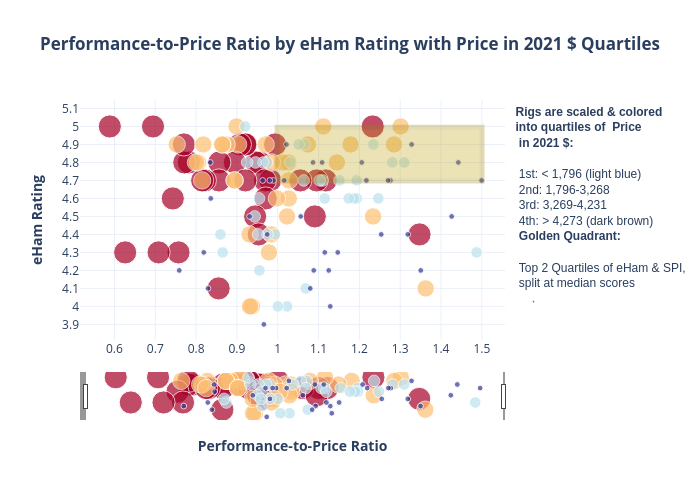
K4fmh's interactive graph and data of "Performance-to-Price Ratio by eHam Rating with Price in 2021 $ Quartiles" is a scatter chart; with Performance-to-Price Ratio in the x-axis and eHam Rating in the y-axis.. The x-axis shows values from 0.5155622228135932 to 1.5567338290316504. The y-axis shows values from 3.821503520722589 to 5.119314300189592.