Edit chart
Loading graph
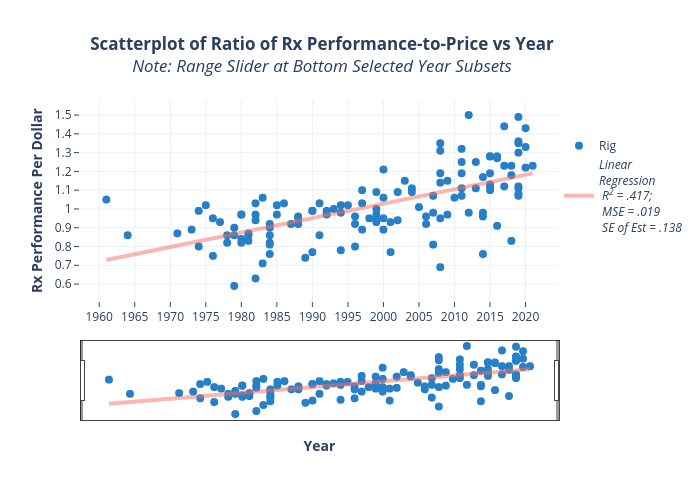
K4fmh's interactive graph and data of "Scatterplot of Ratio of Rx Performance-to-Price vs YearNote: Range Slider at Bottom Selected Year Subsets" is a scatter chart, showing Rig vs LinearRegression R2 = .417; MSE = .019 SE of Est = .138; with Year in the x-axis and Rx Performance Per Dollar in the y-axis.. The x-axis shows values from 1957.2940190050308 to 2024.7059809949692. The y-axis shows values from 0.5195171462357114 to 1.5704828537642885. This visualization has the following annotation: