Edit chart
Loading graph
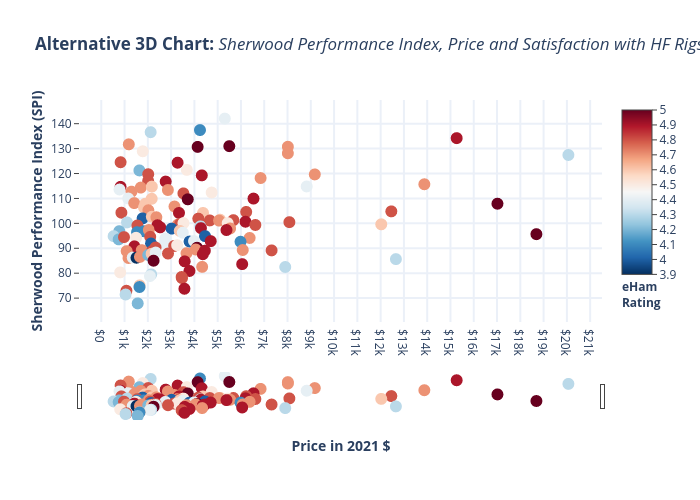
K4fmh's interactive graph and data of "Alternative 3D Chart: Sherwood Performance Index, Price and Satisfaction with HF Rigs" is a scatter chart, showing Rig; with Price in 2021 $ in the x-axis and Sherwood Performance Index (SPI) in the y-axis.. The x-axis shows values from -705.6325577968133 to 21300.75255779681. The y-axis shows values from 61.66862944162436 to 148.25137055837564.