Edit chart
Loading graph
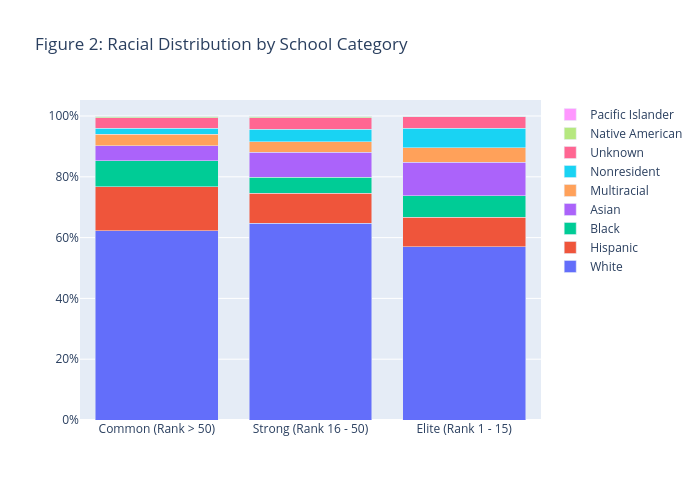
Jzlee's interactive graph and data of "Figure 2: Racial Distribution by School Category" is a stacked bar chart, showing White, Hispanic, Black, Asian, Multiracial, Nonresident, Unknown, Native American, Pacific Islander. The x-axis shows values from 0 to 0. The y-axis shows values from 0 to 0.