Edit chart
Loading graph
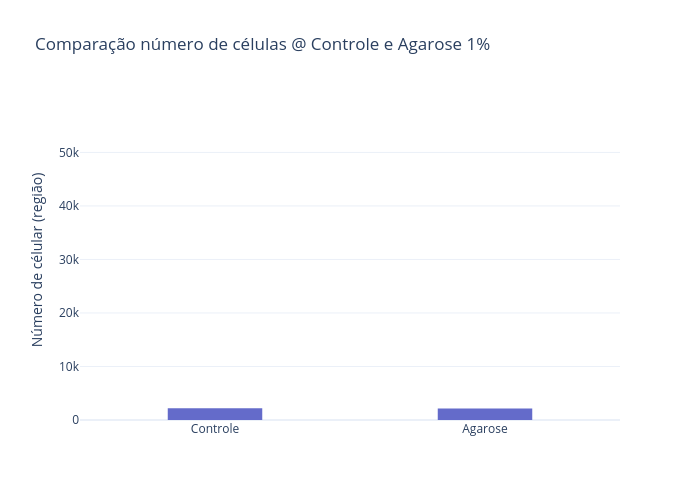
Jullyana.vasconcelos's interactive graph and data of "Comparação número de células @ Controle e Agarose 1%" is a bar chart; with Número de célular (região) in the y-axis. The x-axis shows values from -0.5 to 1.5. The y-axis shows values from 0 to 59793.68421052632.