Edit chart
Loading graph
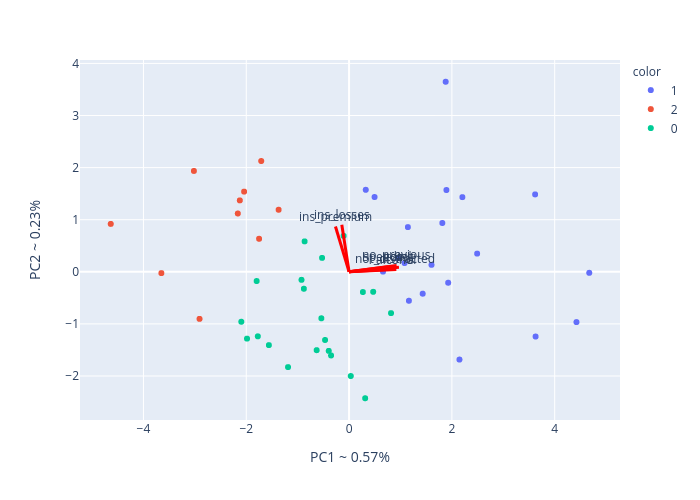
Jsulopzs's interactive graph and data of "PC2 ~ 0.23% vs PC1 ~ 0.57%" is a scatter chart, showing 1, 2, 0; with PC1 ~ 0.57% in the x-axis and PC2 ~ 0.23% in the y-axis.. The x-axis shows values from 0 to 0. The y-axis shows values from 0 to 0. This visualization has the following annotations: total; speeding; alcohol; not_distracted; no_previous; ins_premium; ins_losses