Edit chart
Loading graph
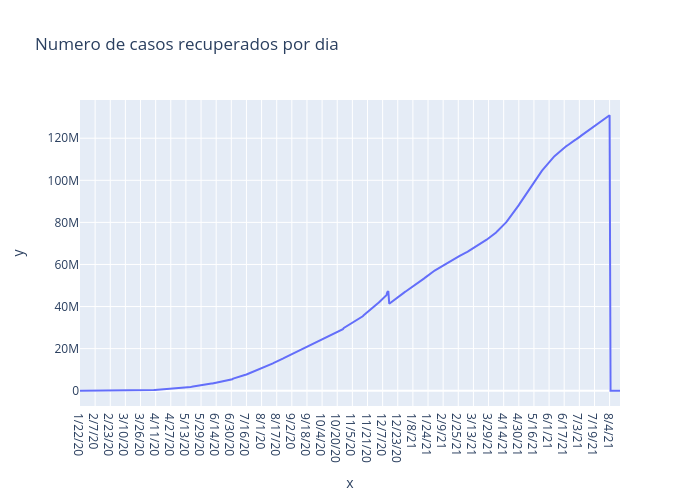
Joser.zapata's interactive graph and data of "Numero de casos recuperados por dia" is a line chart; with x in the x-axis and y in the y-axis.. The x-axis shows values from 0 to 0. The y-axis shows values from 0 to 0.