Edit chart
Loading graph
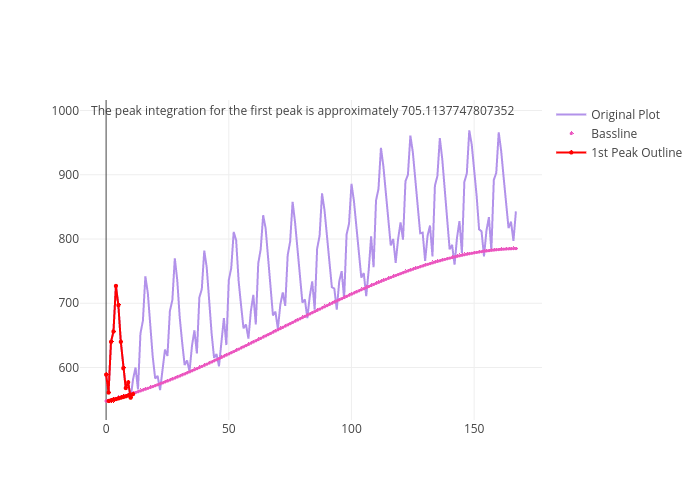
Jordanpeterson's interactive graph and data of "Original Plot, Bassline, 1st Peak Outline" is a line chart, showing Original Plot, Bassline, 1st Peak Outline. The x-axis shows values from 0 to 0. The y-axis shows values from 0 to 0. This visualization has the following annotation: The peak integration for the first peak is approximately 705.1137747807352