Edit chart
Loading graph
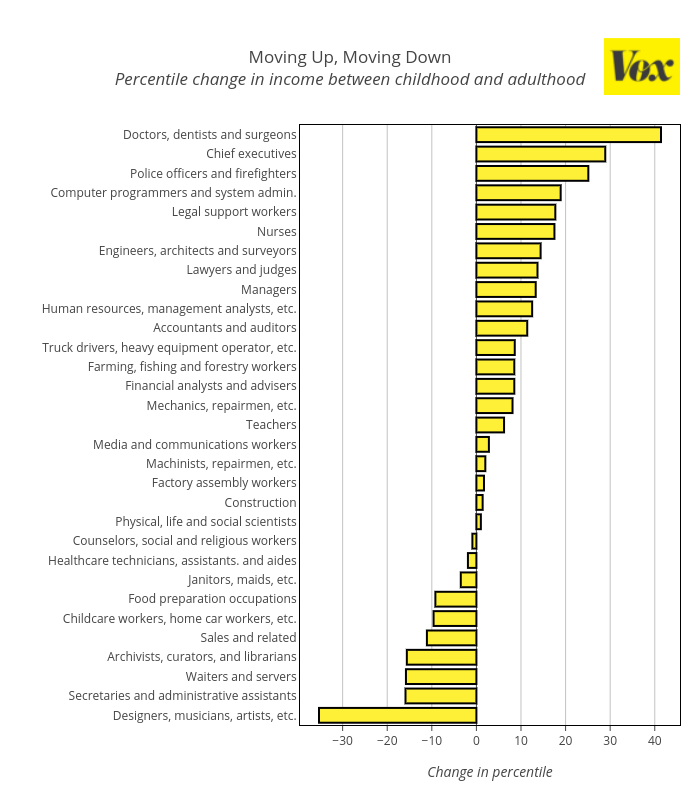
Jordanpeterson's interactive graph and data of "Moving Up, Moving DownPercentile change in income between childhood and adulthood" is a bar chart; with Change in percentile in the x-axis. The x-axis shows values from 0 to 0. The y-axis shows values from 0 to 0.