Edit chart
Loading graph
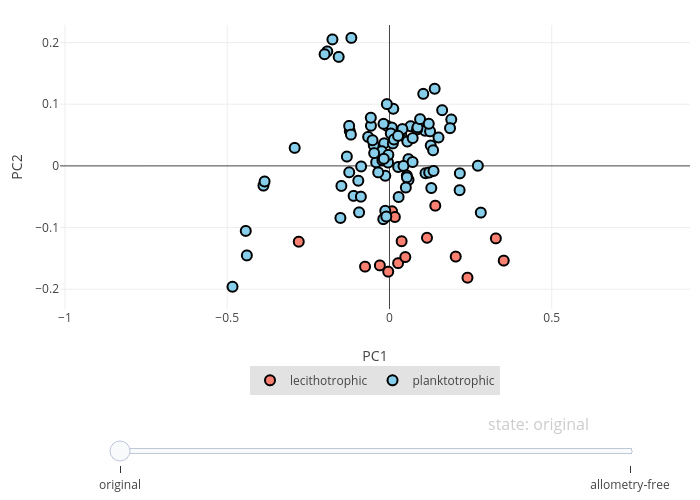
Jinyung's interactive graph and data of "PC2 vs PC1" is a scatter chart, showing lecithotrophic vs planktotrophic; with PC1 in the x-axis and PC2 in the y-axis.. The x-axis shows values from -0.527611289064424 to 0.438412418264454. The y-axis shows values from -0.232088224476953 to 0.22851689450412.