Edit chart
Loading graph
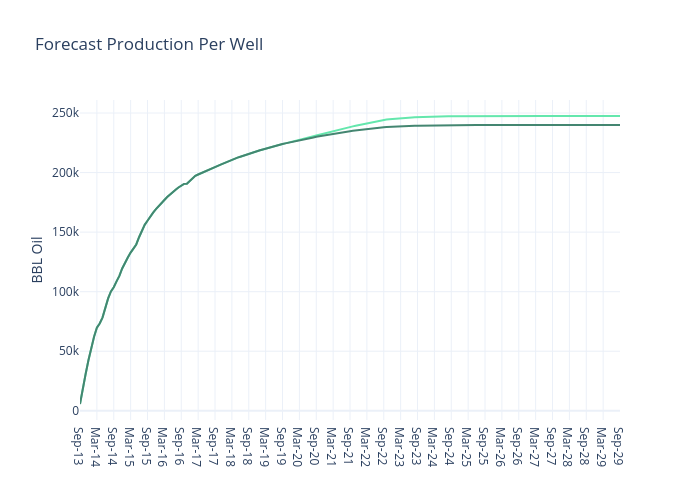
Jferrell's interactive graph and data of "Forecast Production Per Well" is a line chart, showing Pre Shut-In Forecast vs Post Shut-In Forecast; with BBL Oil in the y-axis. The x-axis shows values from 0 to 192. The y-axis shows values from -7721.833333333334 to 260914.83333333334.