Edit chart
Loading graph
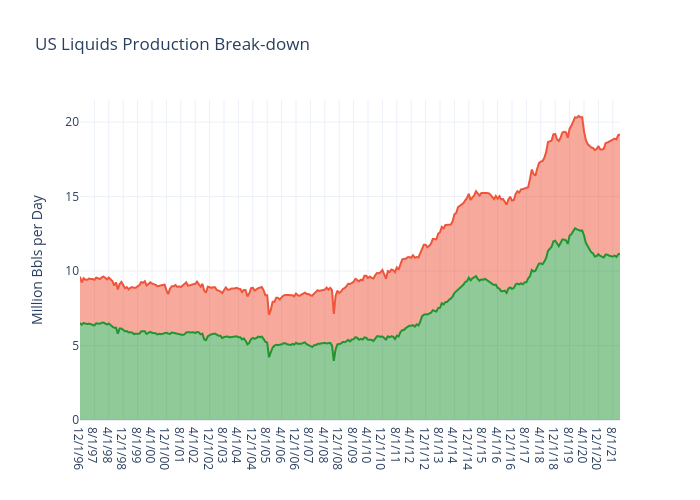
Jferrell's interactive graph and data of "US Liquids Production Break-down" is a line chart, showing Crude Oil Productino vs Other Liquids Production; with Million Bbls per Day in the y-axis. The x-axis shows values from 0 to 300. The y-axis shows values from 0 to 21.48421052631579.