Edit chart
Loading graph
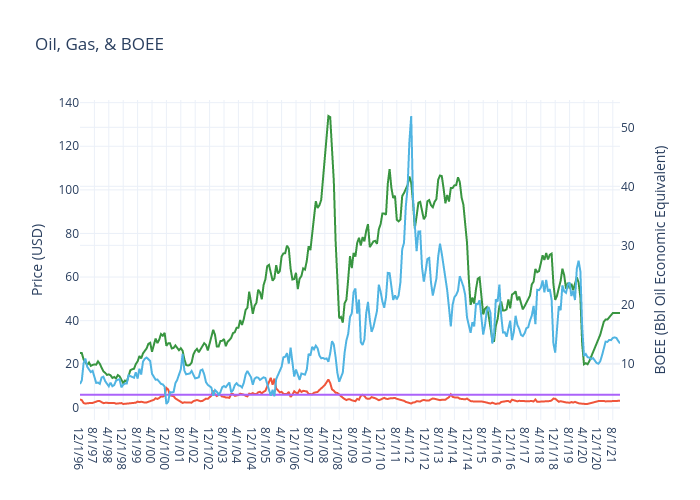
Jferrell's interactive graph and data of "Oil, Gas, & BOEE" is a line chart, showing Oil (WTI), Gas (Henry Hub), BOEE Factor, BOE; with Price (USD) in the y-axis. The x-axis shows values from 0 to 300. The y-axis shows values from -5.569444444444445 to 141.21944444444443.