Edit chart
Loading graph
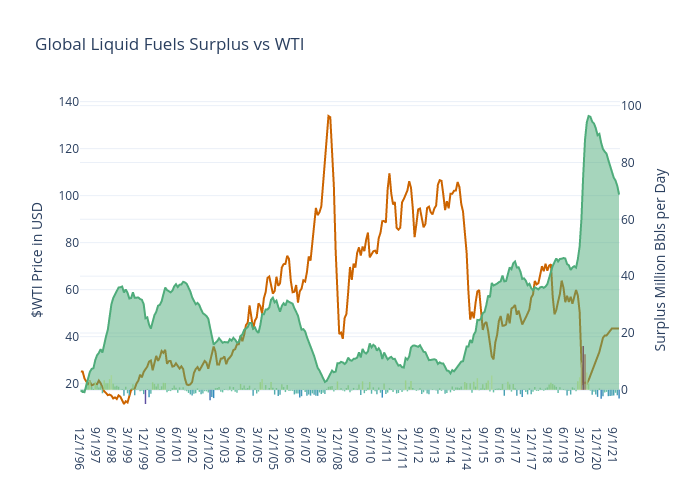
Jferrell's interactive graph and data of "Global Liquid Fuels Surplus vs WTI" is a bar chart, showing Surplus - Deficit, Rolling Surplus, WTI; with $WTI Price in USD in the y-axis. The x-axis shows values from -0.5 to 300.5. The y-axis shows values from 4.542777777777778 to 140.6872222222222.