Edit chart
Loading graph
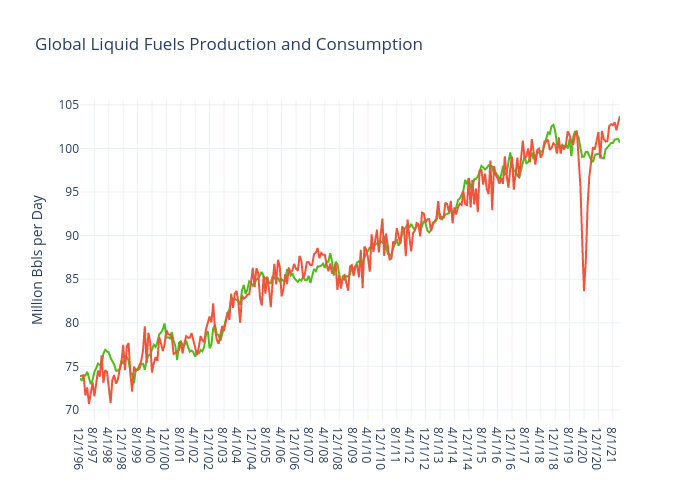
Jferrell's interactive graph and data of "Global Liquid Fuels Production and Consumption" is a line chart, showing Global Oil Production vs Global Oil Consumption; with Million Bbls per Day in the y-axis. The x-axis shows values from 0 to 300. The y-axis shows values from 68.85555555555555 to 105.54444444444444.