Edit chart
Loading graph
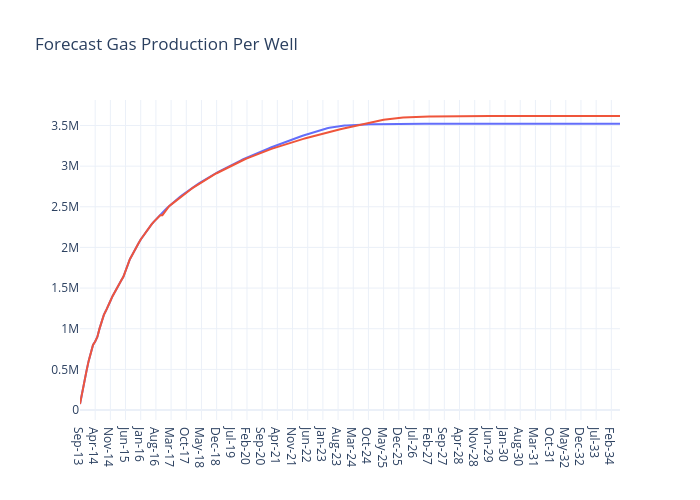
Jferrell's interactive graph and data of "Forecast Gas Production Per Well" is a line chart, showing Pre Shut-In Gas Forecast vs Post Shut-In Gas Forecast. The x-axis shows values from 0 to 249. The y-axis shows values from -122706.72222222222 to 3813427.722222222.