Edit chart
Loading graph
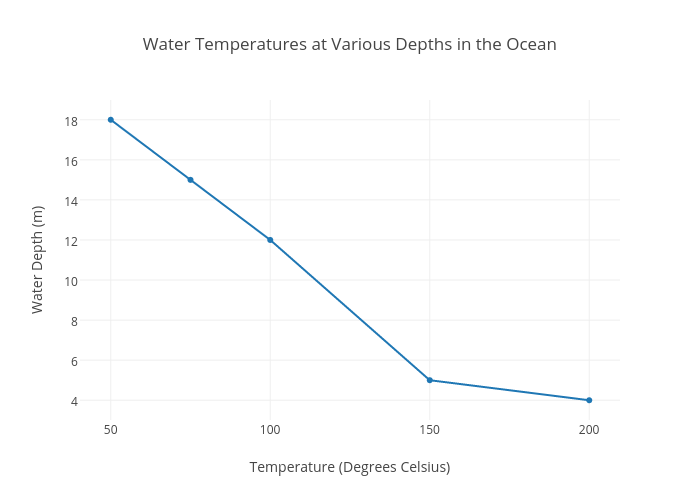
Jesseteer's interactive graph and data of "Water Temperatures at Various Depths in the Ocean" is a scatter chart, showing Col2; with Temperature (Degrees Celsius) in the x-axis and Water Depth (m) in the y-axis.. The x-axis shows values from 36.76470588235294 to 213.23529411764707. The y-axis shows values from 2.948356807511737 to 19.051643192488264.