Edit chart
Loading graph
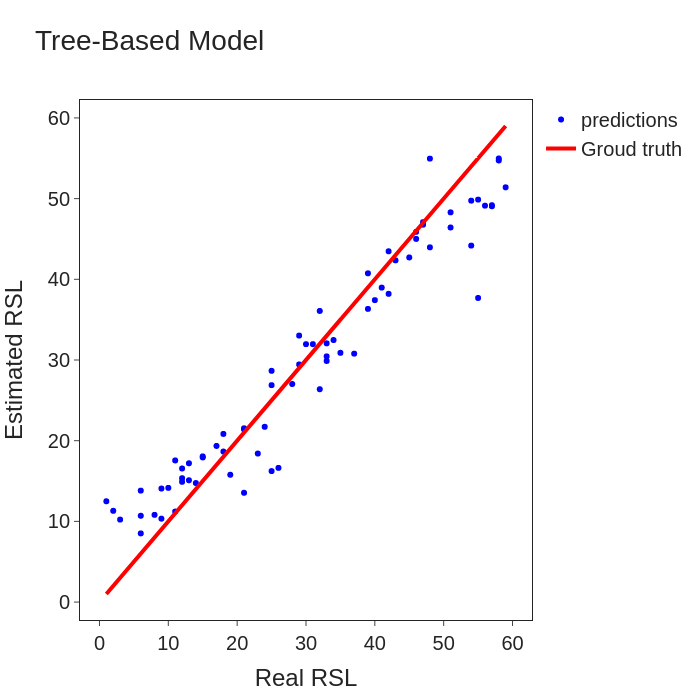
Jeonyl's interactive graph and data of "Tree-Based Model" is a scatter chart, showing predictions vs Groud truth; with Real RSL in the x-axis and Estimated RSL in the y-axis.. The x-axis shows values from 0 to 0. The y-axis shows values from 0 to 0.