Edit chart
Loading graph
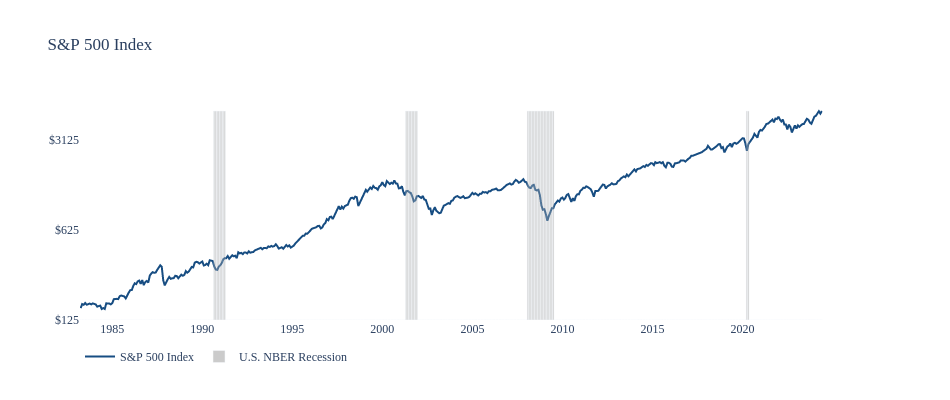
Jdellison5's interactive graph and data of "S&P 500 Index" is a line chart, showing S&P 500 Index vs U.S. NBER Recession. The x-axis shows values from 0 to 0. The y-axis shows values from 0 to 0.