Edit chart
Loading graph
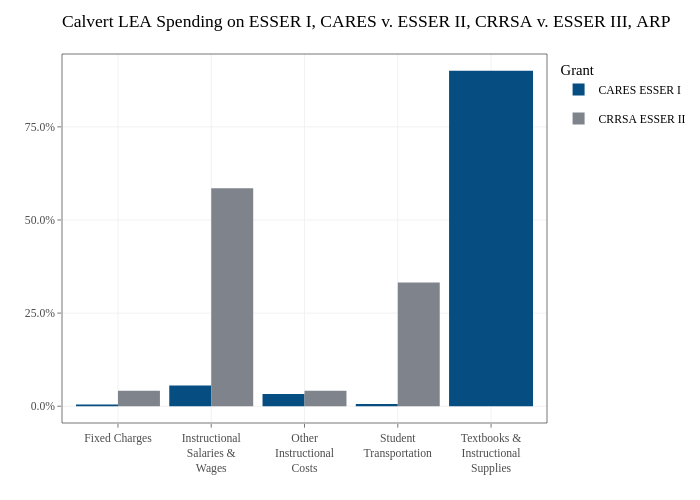
Jdayhoff's interactive graph and data of "Calvert LEA Spending on ESSER I, CARES v. ESSER II, CRRSA v. ESSER III, ARP" is a , showing CARES ESSER I vs CRRSA ESSER II. The x-axis shows values from 0.4 to 5.6. The y-axis shows values from -0.0450280892707039 to 0.945589874684782.