Edit chart
Loading graph
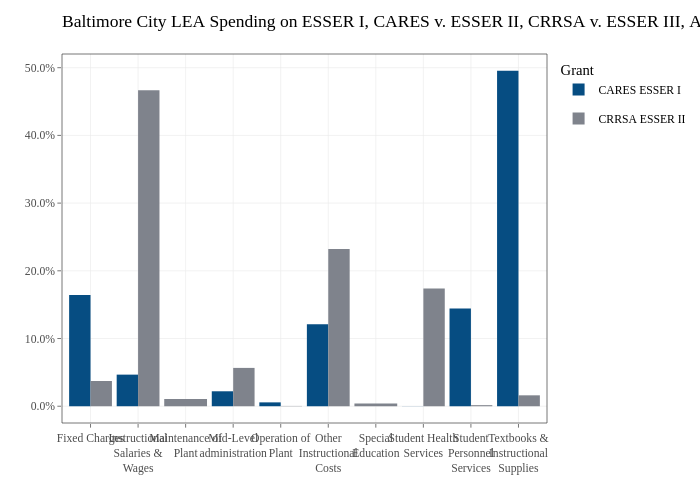
Jdayhoff's interactive graph and data of "Baltimore City LEA Spending on ESSER I, CARES v. ESSER II, CRRSA v. ESSER III, ARP" is a , showing CARES ESSER I vs CRRSA ESSER II. The x-axis shows values from 0.4 to 10.6. The y-axis shows values from -0.0247725085158193 to 0.520222678832205.