Edit chart
Loading graph
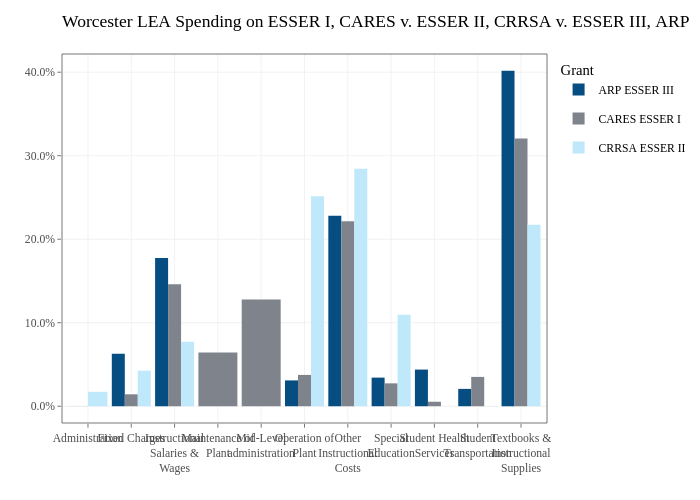
Jdayhoff's interactive graph and data of "Worcester LEA Spending on ESSER I, CARES v. ESSER II, CRRSA v. ESSER III, ARP" is a , showing ARP ESSER III, CARES ESSER I, CRRSA ESSER II. The x-axis shows values from 0.4 to 11.6. The y-axis shows values from -0.0200857977103496 to 0.421801751917341.